Rapid determination of stability by monitoring aggregation and degradation in a single measurement.
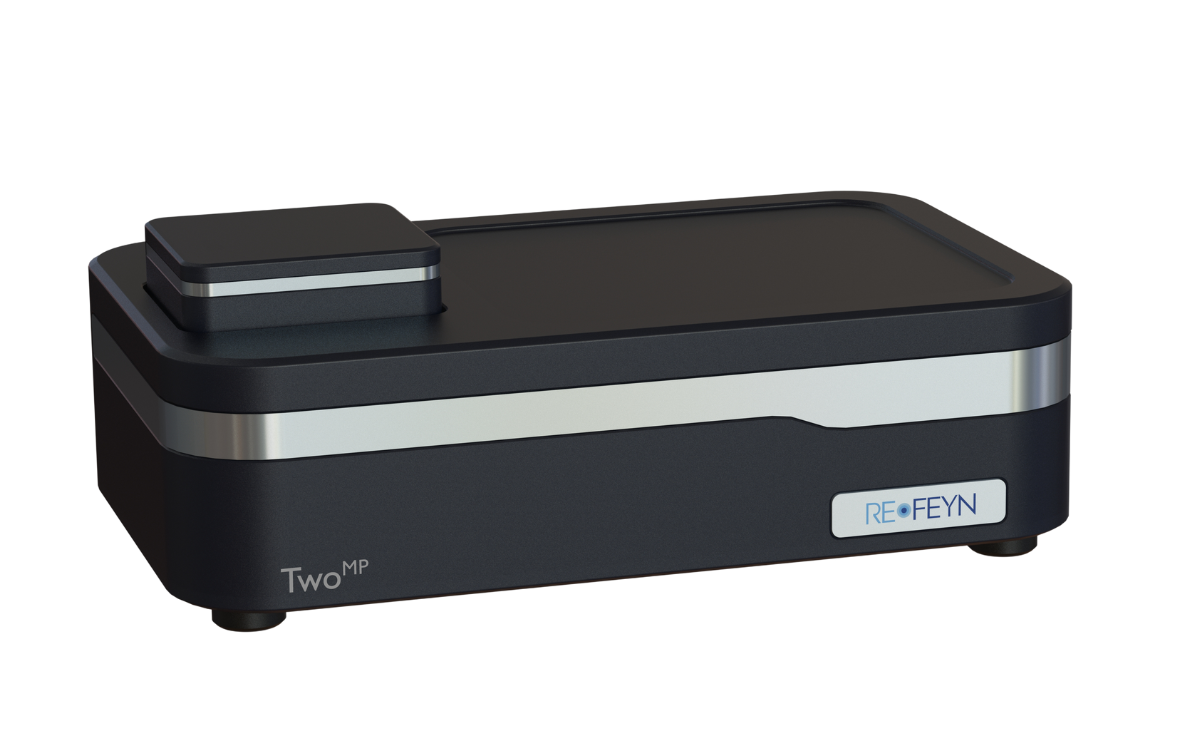
Mass photometry is a revolutionary new method of analyzing molecules. It enables the accurate mass measurements of single molecules in solution, in their native state and without the need for labels. For molecular mass measurements with unmatched sensitivity, speed and simplicity of use, a TwoMP mass photometer offers wide mass range and single-molecule resolution.
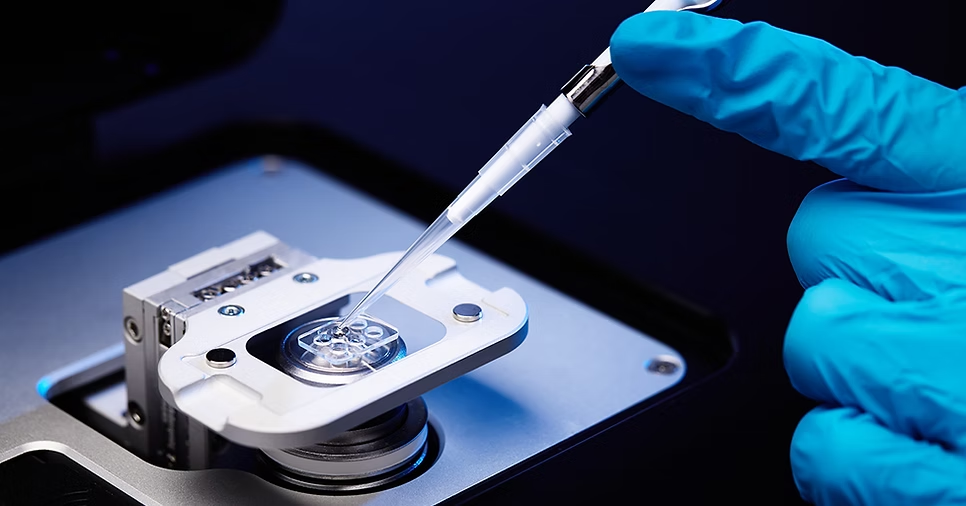
High-fidelity measurements of molecular mass
Minimal quantities of sample required
Intuitive acquisition and data analysis software
Easy setup – a compact, benchtop instrument with minimum installation requirements
With its high sensitivity, the TwoMP is ideally suited for measurements at physiological (i.e. low) concentrations. The high dynamic range intrinsic to single molecule counting techniques ensures low-abundance species are still captured accurately.
Refeyn’s software automatically controls the acquisition process and performs the mass analysis in minutes. You can intuitively interpret the mass distribution results without the need for any prior knowledge.
A compact, bench-top instrument with minimal installation requirements. Measurements only require a few microliters of sample and clean sample-carrier slides.
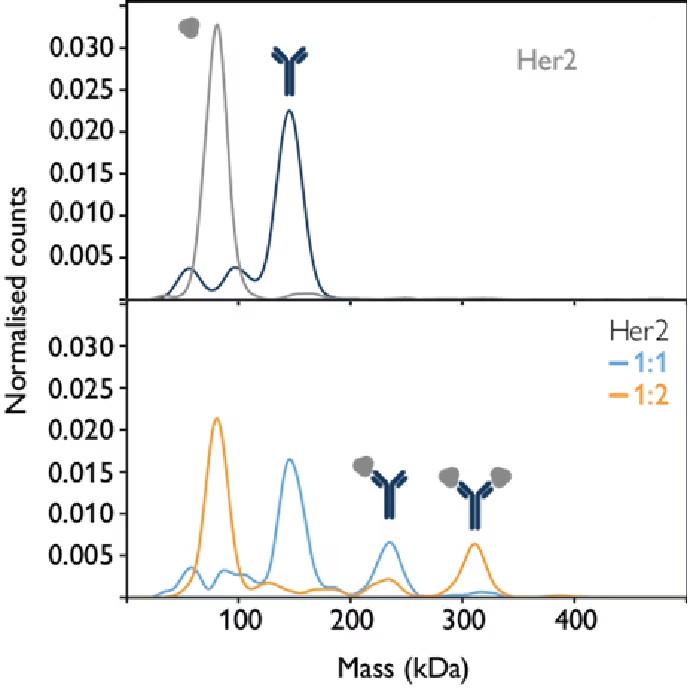
Antigen-antibody interactions are a prime example of molecular systems that can be studied using mass photometry, which can be applied to determine binding affinities for mono- and multivalent interactions.
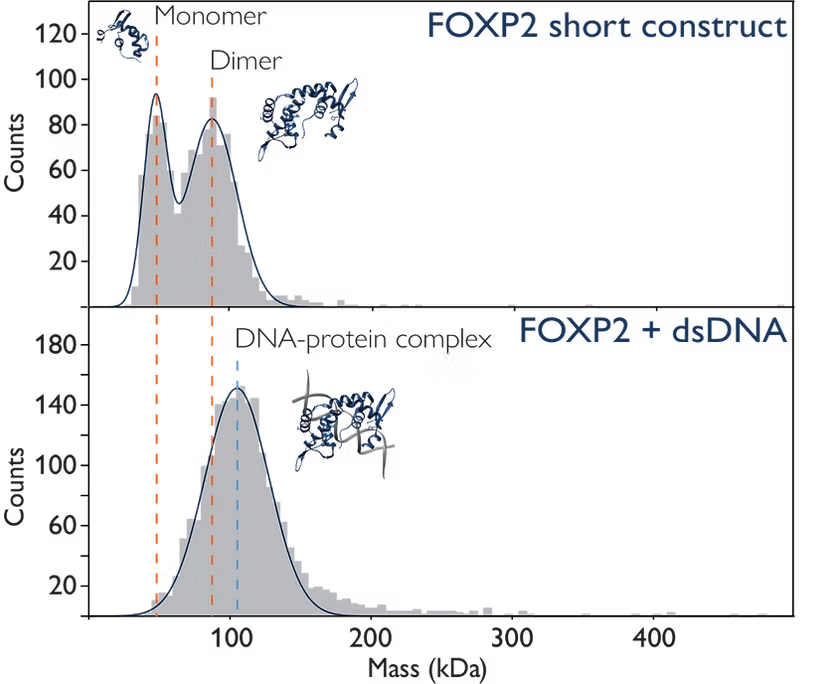
Mass photometry can be used to characterise DNA-protein complexes, which are crucial in gene expression, replication and DNA repair.
In this example, mass photometry not only allows detection of DNA binding but also provides information on how the oligomeric state of the protein changes upon DNA binding (Figure 2).
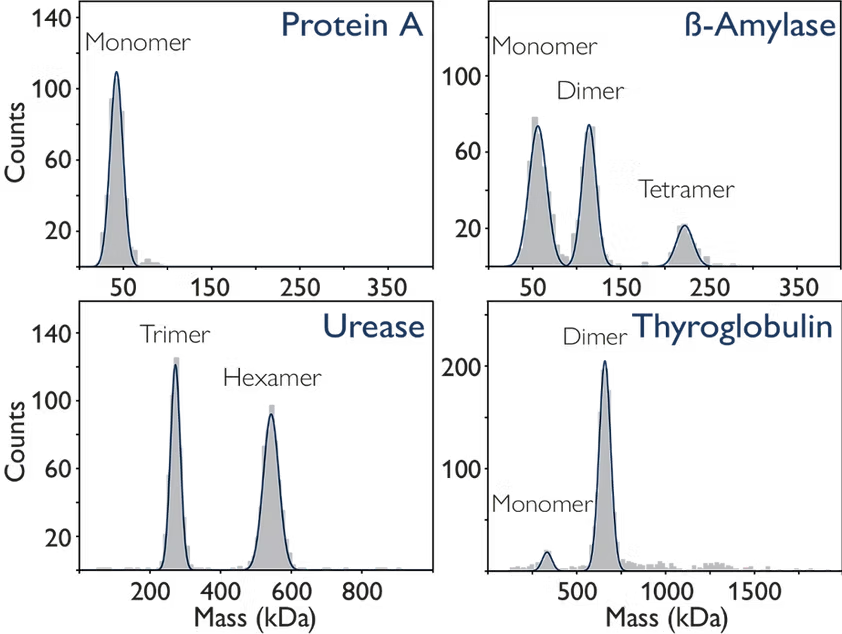
Many proteins adopt a particular oligomeric form under certain conditions. In Figure 1, mass photometry characterises four different proteins: protein A, beta-amylase, urease and thyroglobulin. Through this characterisation, these proteins showcase a range of behaviours – from purely monomeric (as in Protein A) to a dynamic equilibrium between multiple states.
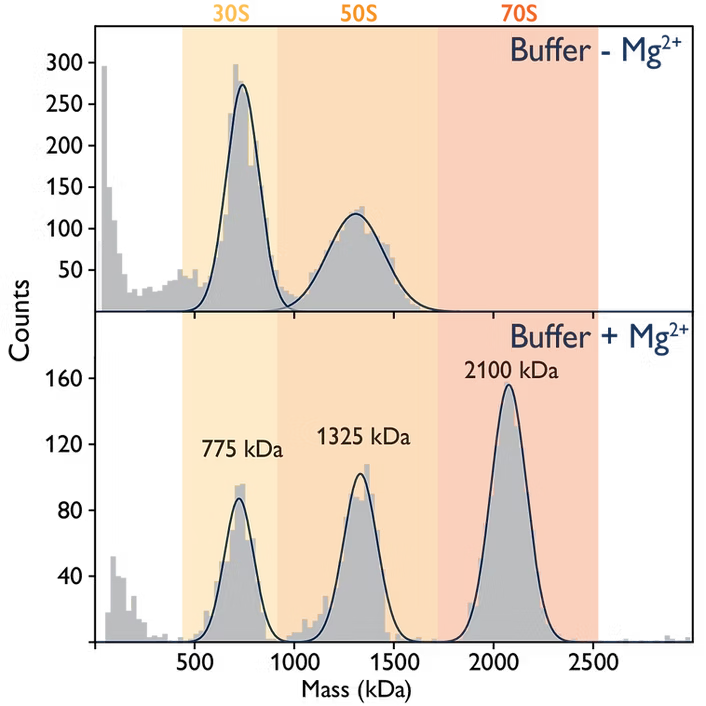
Ribosomes are macromolecular assemblies of protein and RNA, and are central sites for protein synthesis. Bacterial ribosomes (in this example from E. coli) are >2 MDa in size. Magnesium ions play a subtle yet important role in the assembly of intact (70S) complexes. In the absence of magnesium, E. coli ribosomes rapidly disassemble into their 30S and 50S subunits. Mass photometry allows us to monitor these processes (Figure).
The TwoMP has a wide mass range, allowing the study of different biomolecules, including proteins, DNA, RNA, large macromolecular complexes, nanostructures and even small viruses such as AAVs.
The only optimization step necessary prior to a mass photometry measurement is to adjust the final concentration of the sample; the sample concentration on the instrument should be between 100 pM and 100 nM. The optimal concentration range for a mass photometry measurement is 5-20 nM.
For biomolecules within the mass detection range of the TwoMP (30 kDa to 5 MDa), the shape/conformation doesn’t influence the interferometric contrast and thus mass measured by the mass photometer.
In mass photometry, the mass measurement depends on the interference between the light scattered by the molecule and reflected light from the glass surface. This interference signal will be orders of magnitude greater than the fluorescence signal, so the mass measurement will not be affected.
Read this application note to learn how you can use the TwoMP mass photometer to characterize protein-protein interactions, quickly and easily. Discover how you can determine the relative abundance of each protein and the complexes they form in solution, using this label-free bioanalytical tool. Learn also how you can use the mass photometry measurements to calculate the equilibrium dissociation constant (KD) for each interaction.

Check out this webinar to learn how mass photometry compares with size-exclusion chromatography (SEC) in measuring antibody aggregation. In the showcased study, both techniques were used to measure the aggregation levels of a monoclonal antibody used to treat breast cancer and several of its biosimilars.
The pros and cons of mass photometry and SEC for biomolecular characterization are discussed, highlighting the factors that should be considered when analyzing and comparing data generated by these two techniques.

MassFerence P1 is a custom calibrant for the OneMP, TwoMP and TwoMP Auto, designed to calibrate mass photometry measurements of proteins with molecular masses ranging from 90 to 1000 kDa.
Refeyn’s consumables are recommended to ensure consistent measurements with minimum hassle. Click below to order!