Qualitatively characterize large viral vectors for use in cell and gene therapy and vaccine development.
To read more about the science behind this innovative analytical technology, download the white paper.
To read more about Refeyn’s macro mass photometry instrument, visit the KaritroMP product page.
Conventional viral vector characterization techniques create a significant bottleneck in cell and gene therapy and vaccine development workflows. Cell-based assays take days to perform and nanoparticle tracking assays (NTA), while faster, only provide limited data.
Macro mass photometry is a fast, accurate and easy way to characterize large viral vectors, like adenoviruses (AdV) and virus-like particles (VLPs), providing information to inform and optimize process development, including:
• Full/empty capsid ratios
• Particle morphology (size distribution)
• Sample purity
• Vector stability/degradation
Get results within minutes for rapid decision-making
Eliminate dyes and extensive sample prep
Assess sample suitability at any step for downstream processing
Detect quality issues early, saving time and money
Measure vector purity and subpopulations within a sample
Macro mass photometry is the technology that powers Refeyn’s KaritroMP instrument, creating a next-generation tool for the analysis of large viral vectors and virus-like particles.
Developed by Refeyn, macro mass photometry builds on the strong foundation of mass photometry – Refeyn’s game-changing single-particle mass measurement technology. Like mass photometry, macro mass photometry combines sophisticated optics and precise image processing to deliver an illuminating yet user-friendly analysis experience. It performs single-particle, multiparametric analysis in minutes, in solution, with no need for labelling or other time-consuming sample preparation steps.
By measuring particle size and relative mass, macro mass photometry reveals particle subpopulations and distributions in a sample. It gives valuable insights into sample purity, stability and composition – going beyond what can typically be obtained using other methods while using less time and sample.
| Mass photometry | Macro mass photometry | |
|---|---|---|
|
Particle type |
Biomolecules (proteins, nucleic acids, etc.), AAVs |
Large viral vectors (AdVs, VLPs) |
|
Particle range |
30 kDa – 6 MDa mass, << λ of light (Rayleigh regime) |
40 – 150 nm diameter, ≈ λ of light (towards Mie regime) |
|
Parameters measured |
Mass (directly proportional to contrast) |
Contrast, Diameter |
|
What is visualized |
Particles landing (ratiometric approach) |
Immobilized particles (non-ratiometric approach) |
|
Data outputs |
Mass histogram |
Contrast histogram, Size histogram, Size-contrast scatter plot |
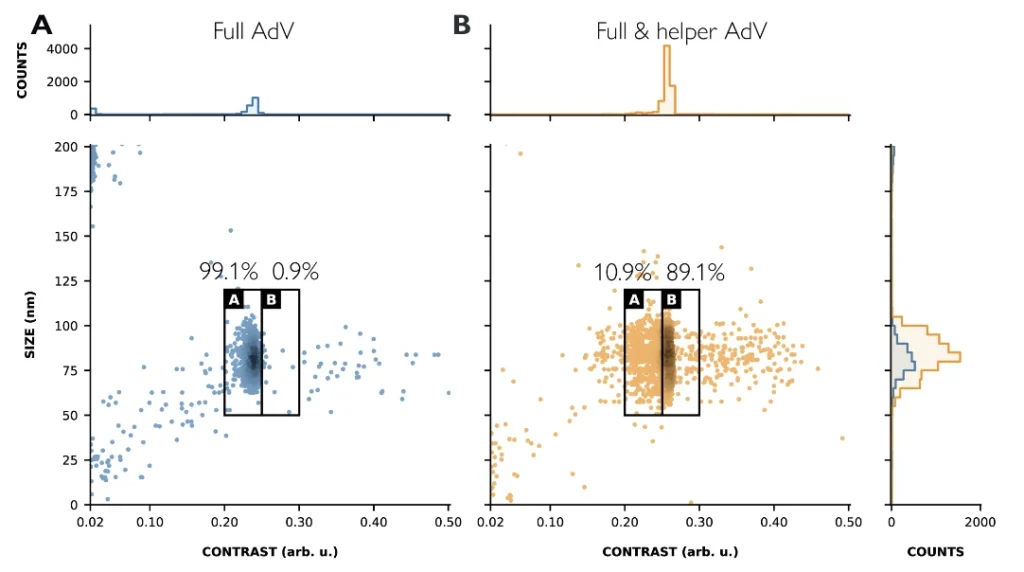
Adenoviral vector characterization
Macro mass photometry analysis detects full adenovirus versus helper adenovirus, an important impurity that must be removed as part of downstream processing to reduce immunogenicity in cell and gene therapies.
See the data in our white paper.
The KaritroMP macro mass photometer is a powerful benchtop instrument that can be used to characterize large viral vectors (like adeno, lenti and VLPs) in minutes.
Visually resolve distinct vector populations and reveal changes over time during R&D and process development to optimize vector production.
Learn how macro mass photometry facilitates rapid qualitative analysis of single viral particles, useful for comparing production and purification methods and detecting batch variations in cell and gene therapy development and manufacturing.

Discover how macro mass photometry addresses the bottleneck of vector characterization, helping to accelerate cell and gene therapy and vaccine development and manufacturing workflows.
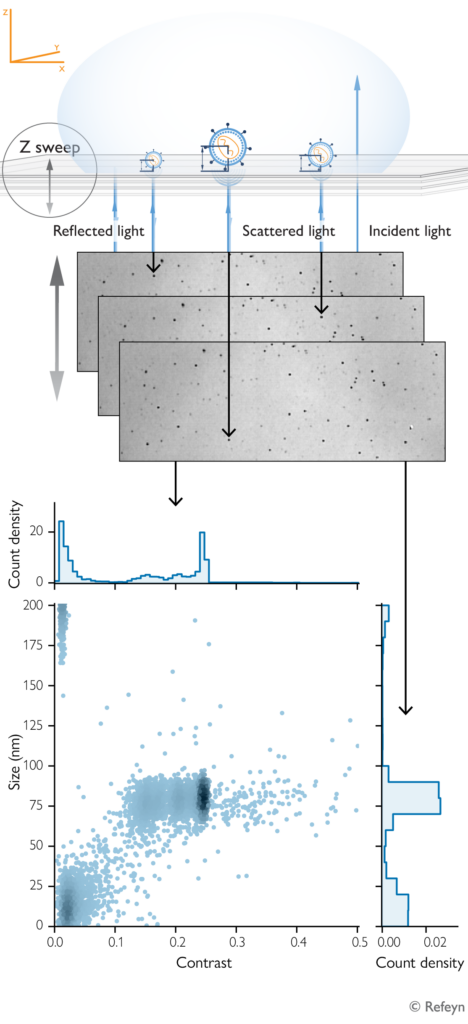
Particle scattering contrast (‘contrast’ for short) is a proxy for particle mass. The contrast provides a way to differentiate particles that would not be resolvable based on size alone.
Macro mass photometry analyzes individual particles, providing data on two parameters simultaneously: Particle scattering contrast (a proxy for mass) and size (diameter).
Macro mass photometry builds on the physical principles used in mass photometry and introduces an additional measurement parameter: Size. In contrast to mass photometry, macro mass photometry is optimized for characterizing larger particles, such as adenoviruses (AdV), lentiviruses and virus-like particles (VLPs).
[1] G. Young et al., ‘Quantitative mass imaging of single biological macromolecules’, Science, vol. 360, no. 6387, pp. 423–427, Apr. 2018, doi: 10.1126/science.aar5839.
[2] D. Cole, G. Young, A. Weigel, A. Sebesta, and P. Kukura, ‘Label-Free Single-Molecule Imaging with Numerical-Aperture-Shaped Interferometric Scattering Microscopy’, ACS Photonics, vol. 4, no. 2, pp. 211–216, Feb. 2017, doi: 10.1021/acsphotonics.6b00912.
[3] H. Verschueren, ‘Interference reflection microscopy in cell biology: methodology and applications’, Journal of Cell Science, vol. 75, pp. 279–301, Apr. 1985, doi: 10.1242/jcs.75.1.279.
[4] J. Ortega-Arroyo and P. Kukura, ‘Interferometric scattering microscopy (iSCAT): new frontiers in ultrafast and ultrasensitive optical microscopy’, Physical Chemistry Chemical Physics, vol. 14, no. 45, pp. 15625–15636, 2012, doi: 10.1039/c2cp41013c.