Mass photometry and size-exclusion chromatography (SEC) are both analytical methods that can provide valuable insights into the biomolecular composition of samples. SEC is considered a gold standard for protein analysis and is often used to quantify aggregation and oligomerization. It therefore represents an ideal comparator for mass photometry – a much newer technique that can be used in a similar way.
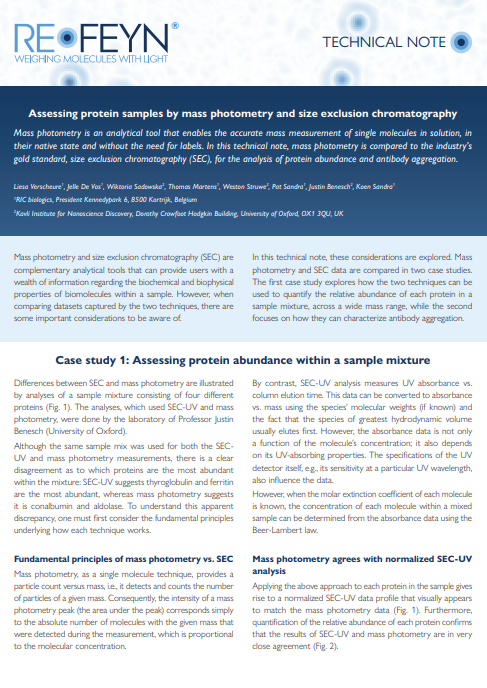
This article summarizes the key findings reported in a technical note, Assessing protein samples by mass photometry and size exclusion chromatography, which compares the two techniques’ performance in analyses of protein abundance and antibody aggregation.
The underlying principles of mass photometry vs. SEC
Mass photometry is a label-free analytical method that determines the mass of single molecules, in solution, by measuring light scattering as each molecule lands on a glass slide. This technique, with its one-minute analysis run-time, enables the precise and rapid assessment of the relative abundance of each protein species in a sample. It can provide information on oligomerization, interactions, complex formation and sample homogeneity.
SEC is a method in that separates molecules by their size (hydrodynamic radius), based on the time they take to pass through a column containing beads with pores distributed across a specific range of sizes. Coupled with UV absorbance detection (SEC-UV) and provided that molar extinction coefficients are known, it provides information on analyte concentration. Coupled to multi-angle light scattering (SEC-MALS), it can measure both the size and molecular weight of the analytes in a 30-minute analysis run-time. From this analysis, users can assess the purity of their protein samples.
Comparison 1: A simple assessment of protein abundance within a sample mixture
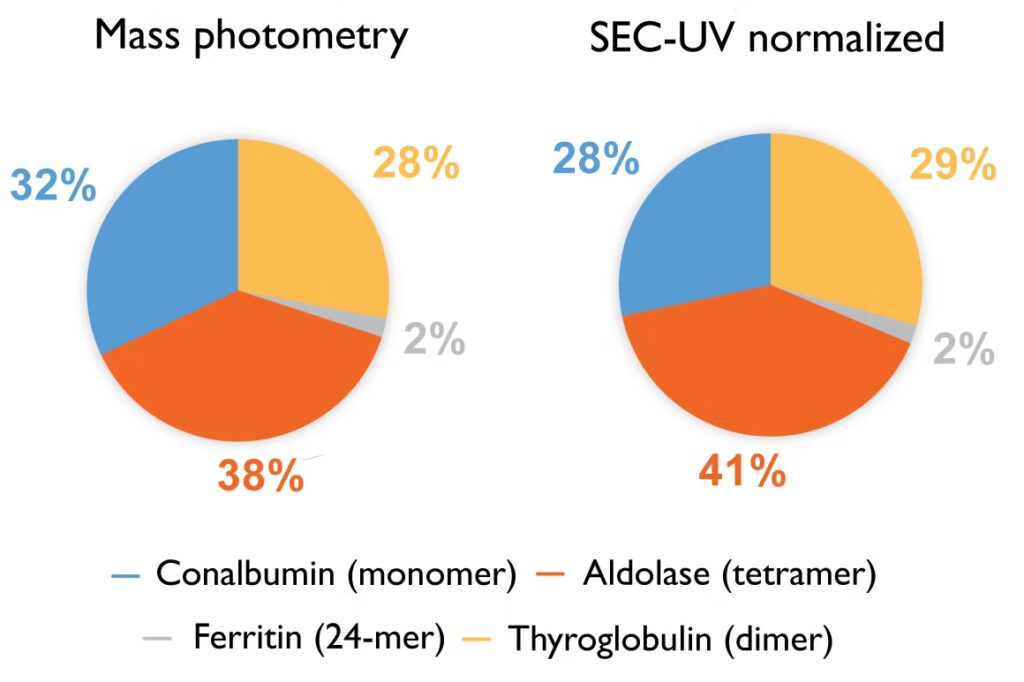
In the first case study reported in the technical note, from the University of Oxford’s Kavli Institute for Nanoscience Discovery, a four-protein sample mixture was characterized with both mass photometry and SEC-UV, with each method quantifying the abundance of each protein within the mixture. The results showed that SEC-UV data, once it has been normalized (converted from absorbance to molar concentration via molar extinction coefficients), aligns closely with the mass photometry measurements (Fig. 1).
Comparison 2: Monitoring aggregation of monoclonal antibody biosimilars
In the second case study reported in the technical note, by RIC biologics (Kortrijk, Belgium), antibody aggregation was monitored using both mass photometry and SEC-UV. The methods were used to assess aggregation by measuring monomer-to-dimer ratios in samples of the monoclonal antibody and four biosimilars.
Results from mass photometry (Fig. 2) were again consistent with those obtained using SEC-UV (normalized). The comparison confirmed the validity and utility of mass photometry as an orthogonal analytical technique for antibody sample characterization.
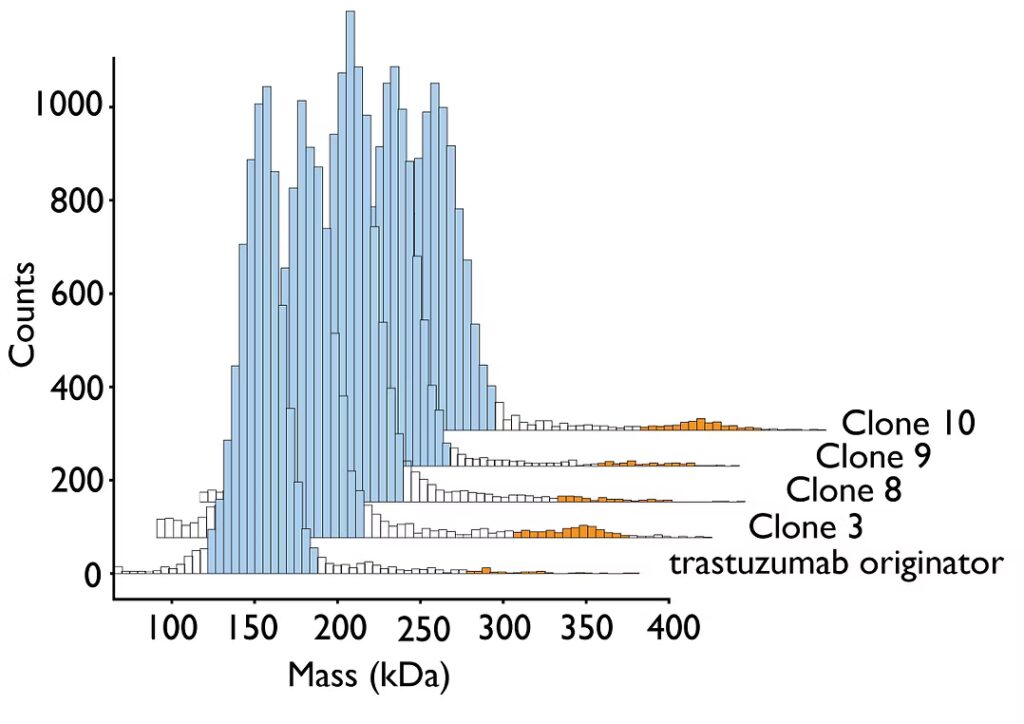
Figure: 2 Mass photometry was used to characterize aggregation in monoclonal antibody samples. Monomer populations are highlighted in blue, dimer populations in orange. For more information, download the technical note Assessing protein samples by mass photometry and size exclusion chromatography.
Obtain the full details on how mass photometry compares to SEC for characterizing antibody aggregation
Learn how mass photometry and SEC-UV compare and how they can both offer valuable insights into protein sample analysis through two case studies: By RIC biologics (Kortrijk, Belgium) and the University of Oxford’s Kavli Institute for Nanoscience Discovery.
Additional resources on using mass photometry to characterize protein samples
APPLICATION NOTE : Characterization of forced antibody degradation with automated mass photometry
Learn how mass photometry can help assess changes in antibody behavior under various stress conditions. Discover how it can be used to analyze the fragmentation and aggregation of therapeutic antibodies in response to stressors like light, pH variations, and peroxide exposure. Find out the advantages automated mass photometry can offer, in terms of processing multiple samples with high reproducibility, across a wide mass range.
APPLICATION NOTE : Characterization of protein interaction equilibria
Discover how mass photometry was used to study the oligomerization process of a recombinant protein that forms tetramers. Using this multimeric protein as an example, you can see how scientists measured the relative abundances of each oligomeric species across a range of physiologically relevant protein concentrations and assessed the effect of environmental factors (such as temperature) on reaction equilibria.
To discuss how mass photometry can complement your analytical toolbox for antibody characterization
More Application Notes
Browse through our catalogue of application notes highlighting some recent case studies featuring mass photometry.